
The Normal distribution is such an important model in statistics, but students are often bombarded with notation and calculations before they have a secure understanding of what the model represents.
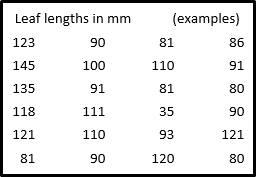
I've created this presentation to give a clear example of how the Normal distribution can be used to model the lengths of leaves from a particular tree - a huge bay tree that was in my back garden - also home to a cute little DIY tree house when my kids were younger. I enlisted my children to measure the lengths of hundreds of leaves from the tree. These were processed by my A level maths students, and represented as a histogram. Over the top of this actual data, I then modelled the normal distribution by calculating its probability density function at various points.
More recently I've been able to demonstrate this dynamically by creating animated graphs in DESMOS.
If you follow the DESMOS link you can experiment by dragging buttons on screen - to change the mean and standard deviation - and get a feel for the modelling. The presentation/video describes the context and the modelling process more fully. Look out for further blog-posts about how to perform various calculations with the Normal distribution and for applications to hypothesis testing.


Commentaires